Image

Finances
The RISD Museum is an integral part of the Rhode Island School of Design, a non-profit institution. As a non-profit, we are responsible for raising funds (from individual donations, grants, and more) and generating revenue (through facility rentals and sales of publications, for example) to support our operations, as well as spending those funds in accordance with our mission to benefit the public. This section breaks down where our income comes from, as well as how we spend it.
Due to our closure throughout most of fiscal year 2021, income from admissions, rentals, and other operations was drastically reduced, resulting in a nearly 17% drop in our annual income from fiscal year 2020. The museum was very fortunate to receive COVID relief funds from the National Endowment for the Humanities, along with local foundations and the Rhode Island State Council on the Arts, making it possible to retain staff and undertake projects to care for the collection that would not have been possible while our facilities were open to the public. We adjusted expenditures based on this anticipated drop in income and were able to end FY21 with a balanced budget of $7,221,258.34.
IncomeTOP ↑
Each year, the museum receives support from a variety of sources. This chart illustrates the types of income we received in fiscal year 2020–2021, along with further explanation of what comprises each category.
Image

Annual Giving (4%)
Donations given for general purposes
Revenue (6%)
Income from admissions, museum memberships, publication sales, touring exhibition fees, museum tours, and special programs
Grants and Designated Gifts (52%)
Grants from private foundations and government entities, donations from individuals designated for specific purposes, income from endowments
Institutional Support (38%)
As an integral part of RISD, the museum receives financial support from the college for the work we do to serve students, faculty, and community members. The museum also receives in-kind support from RISD in the form of utilities and central services (e.g., mail, payroll, human resources, etc.).
Spending TOP ↑
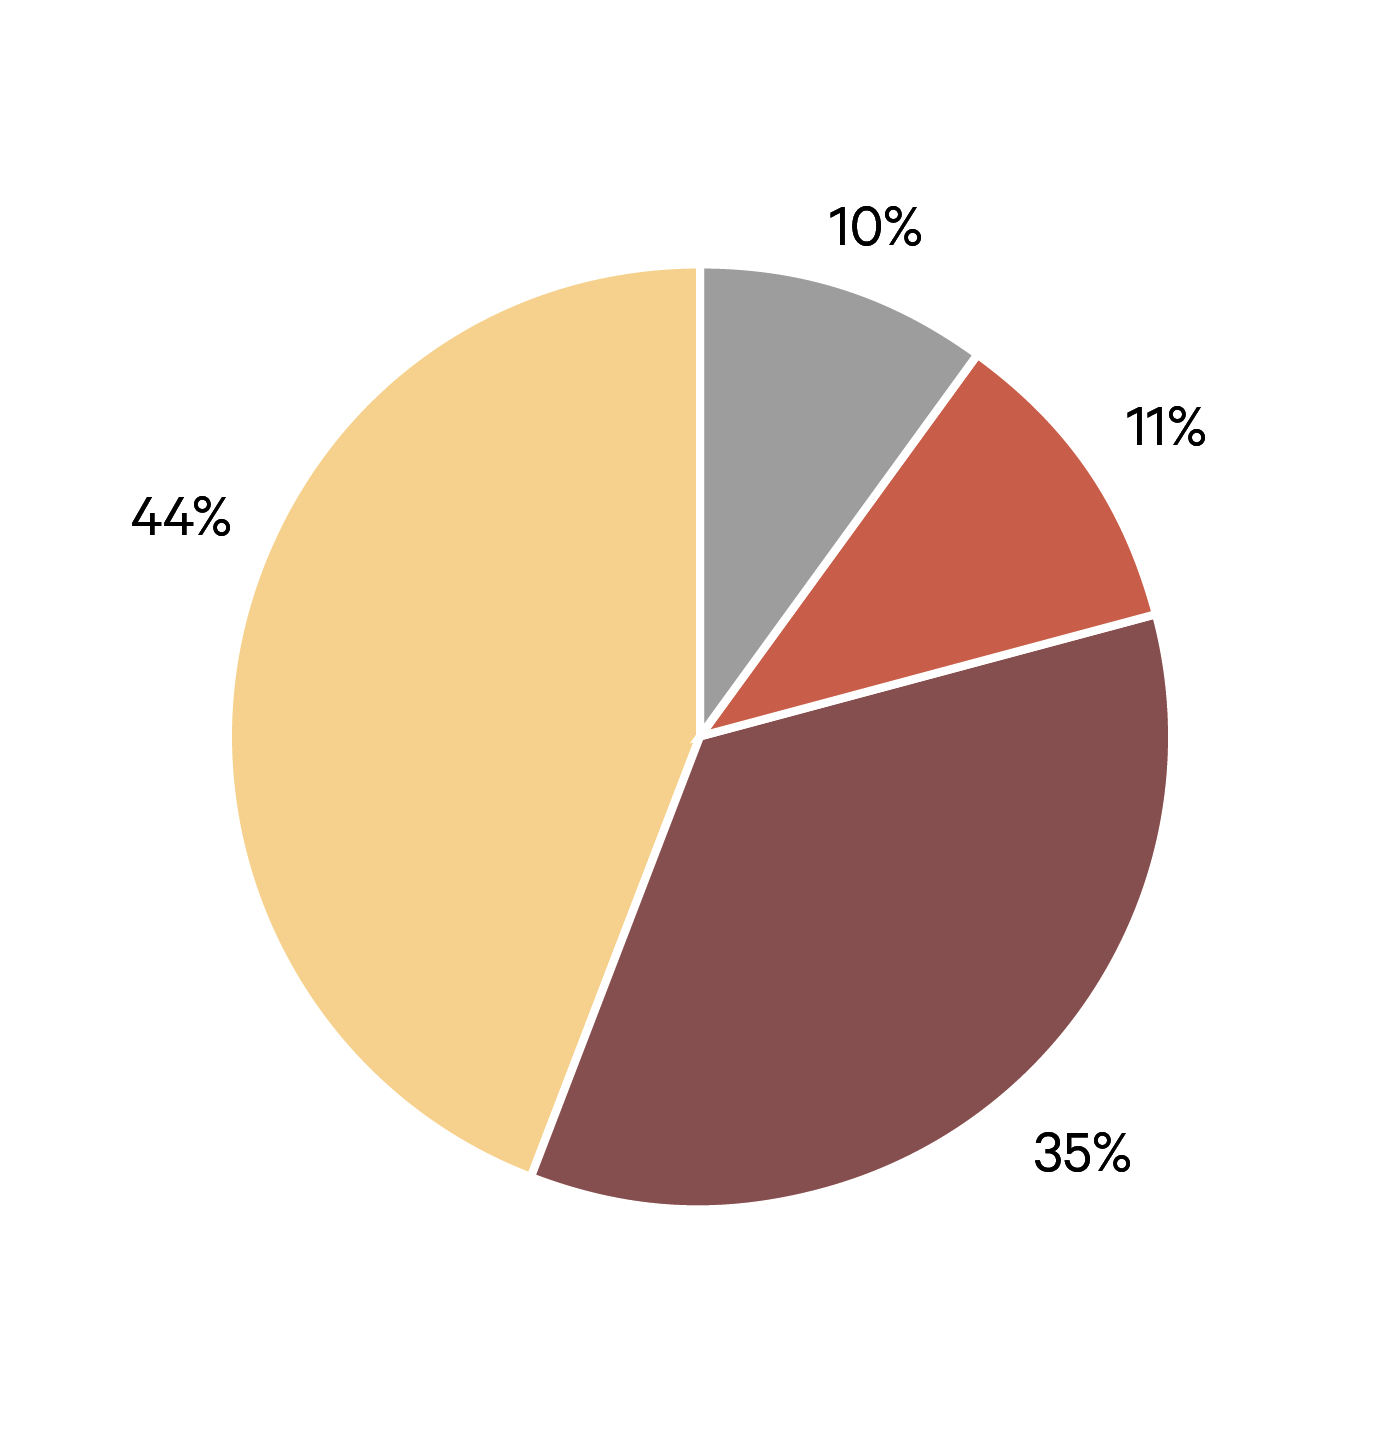
This chart illustrates how the museum spent the money we received in fiscal year 2020–21, with further explanation of what comprises each category.
Image

Operations (10%)
Administrative and custodial personnel and expenses, database subscriptions, institutional memberships (e.g., Alliance of Art Museums, New England Museum Association), general equipment, and supplies
External Affairs (11%)
Fundraising and marketing personnel and expenses, advertising and publicity expenses, expenses related to museum membership program and special events
Collections (35%)
Conservation, curatorial, and registration personnel and expenses; object photography and storage; object loans; rights and reproduction expenses
Engagement (44%)
Personnel and expenses related to museum education (public and academic, family and teen, and school and teacher programs), exhibition installation and events, security and visitor services, digital and print publications, and museum website

