Image
Ilhee Park
CONNECT: Translating Complexity through Visual Simplification
CONNECT: Translating Complexity through Visual Simplification brings complex data into concise visual systems that encourage ease of access. With a background in Human Factors Engineering, user engagement remains a central focus in my design. Whether reducing barriers to scientific information or untangling deeply complex data, design must contain intuitive concepts without the need for extended explanation. Using bold color and geometric shapes as the core design language to render pictorial narratives, this thesis maps my development as an information designer through modes of gathering, deciphering, and interpreting.
Image
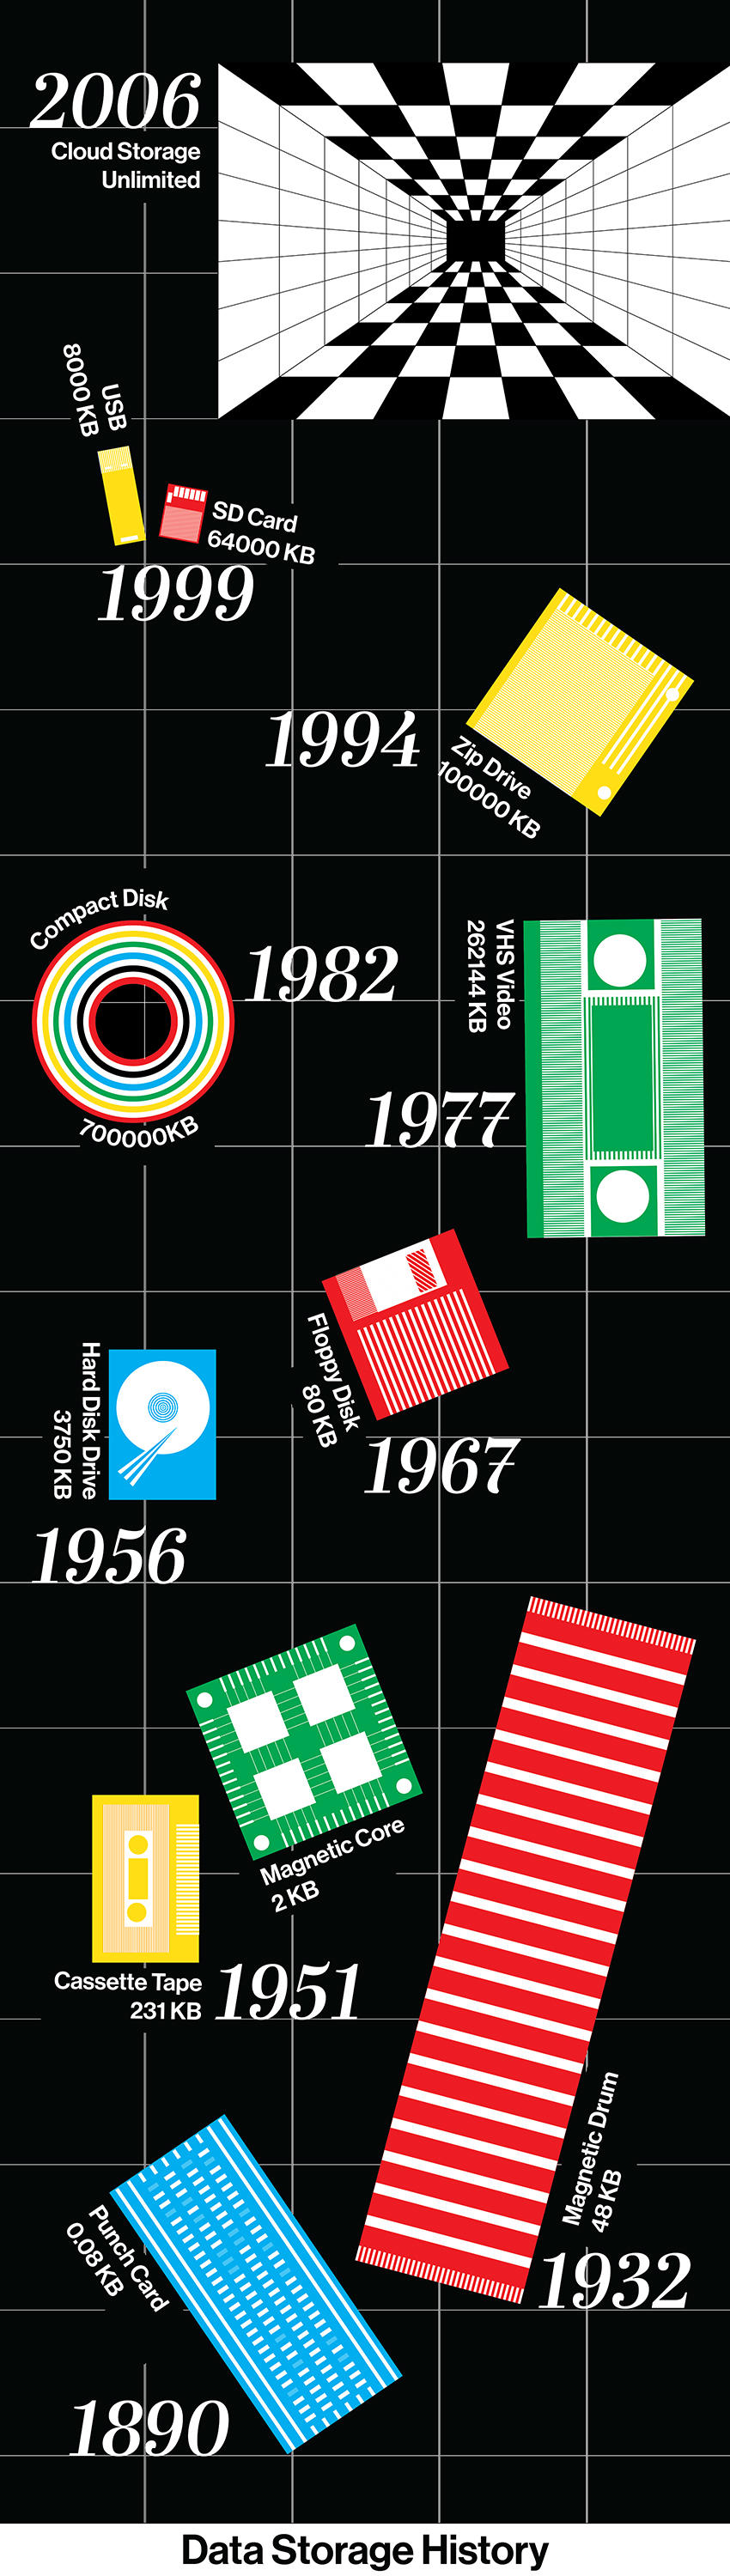
Data Storage History
Information Design, Graphic poster
17*60 in
2022
I represent Data storage history by using simplified graphic language. It starts from the punch card and ends at the cloud storage, which has unlimited volume. Each graphic also represents the real dimensions/ratio of data storage physically, so that people can sense the form and size. Especially as we are seeing cloud storage through the monitor, I decided to use a monitor screen size to represent the cloud storage. Each icon is organized by the year when it first arrived in the world.
Image
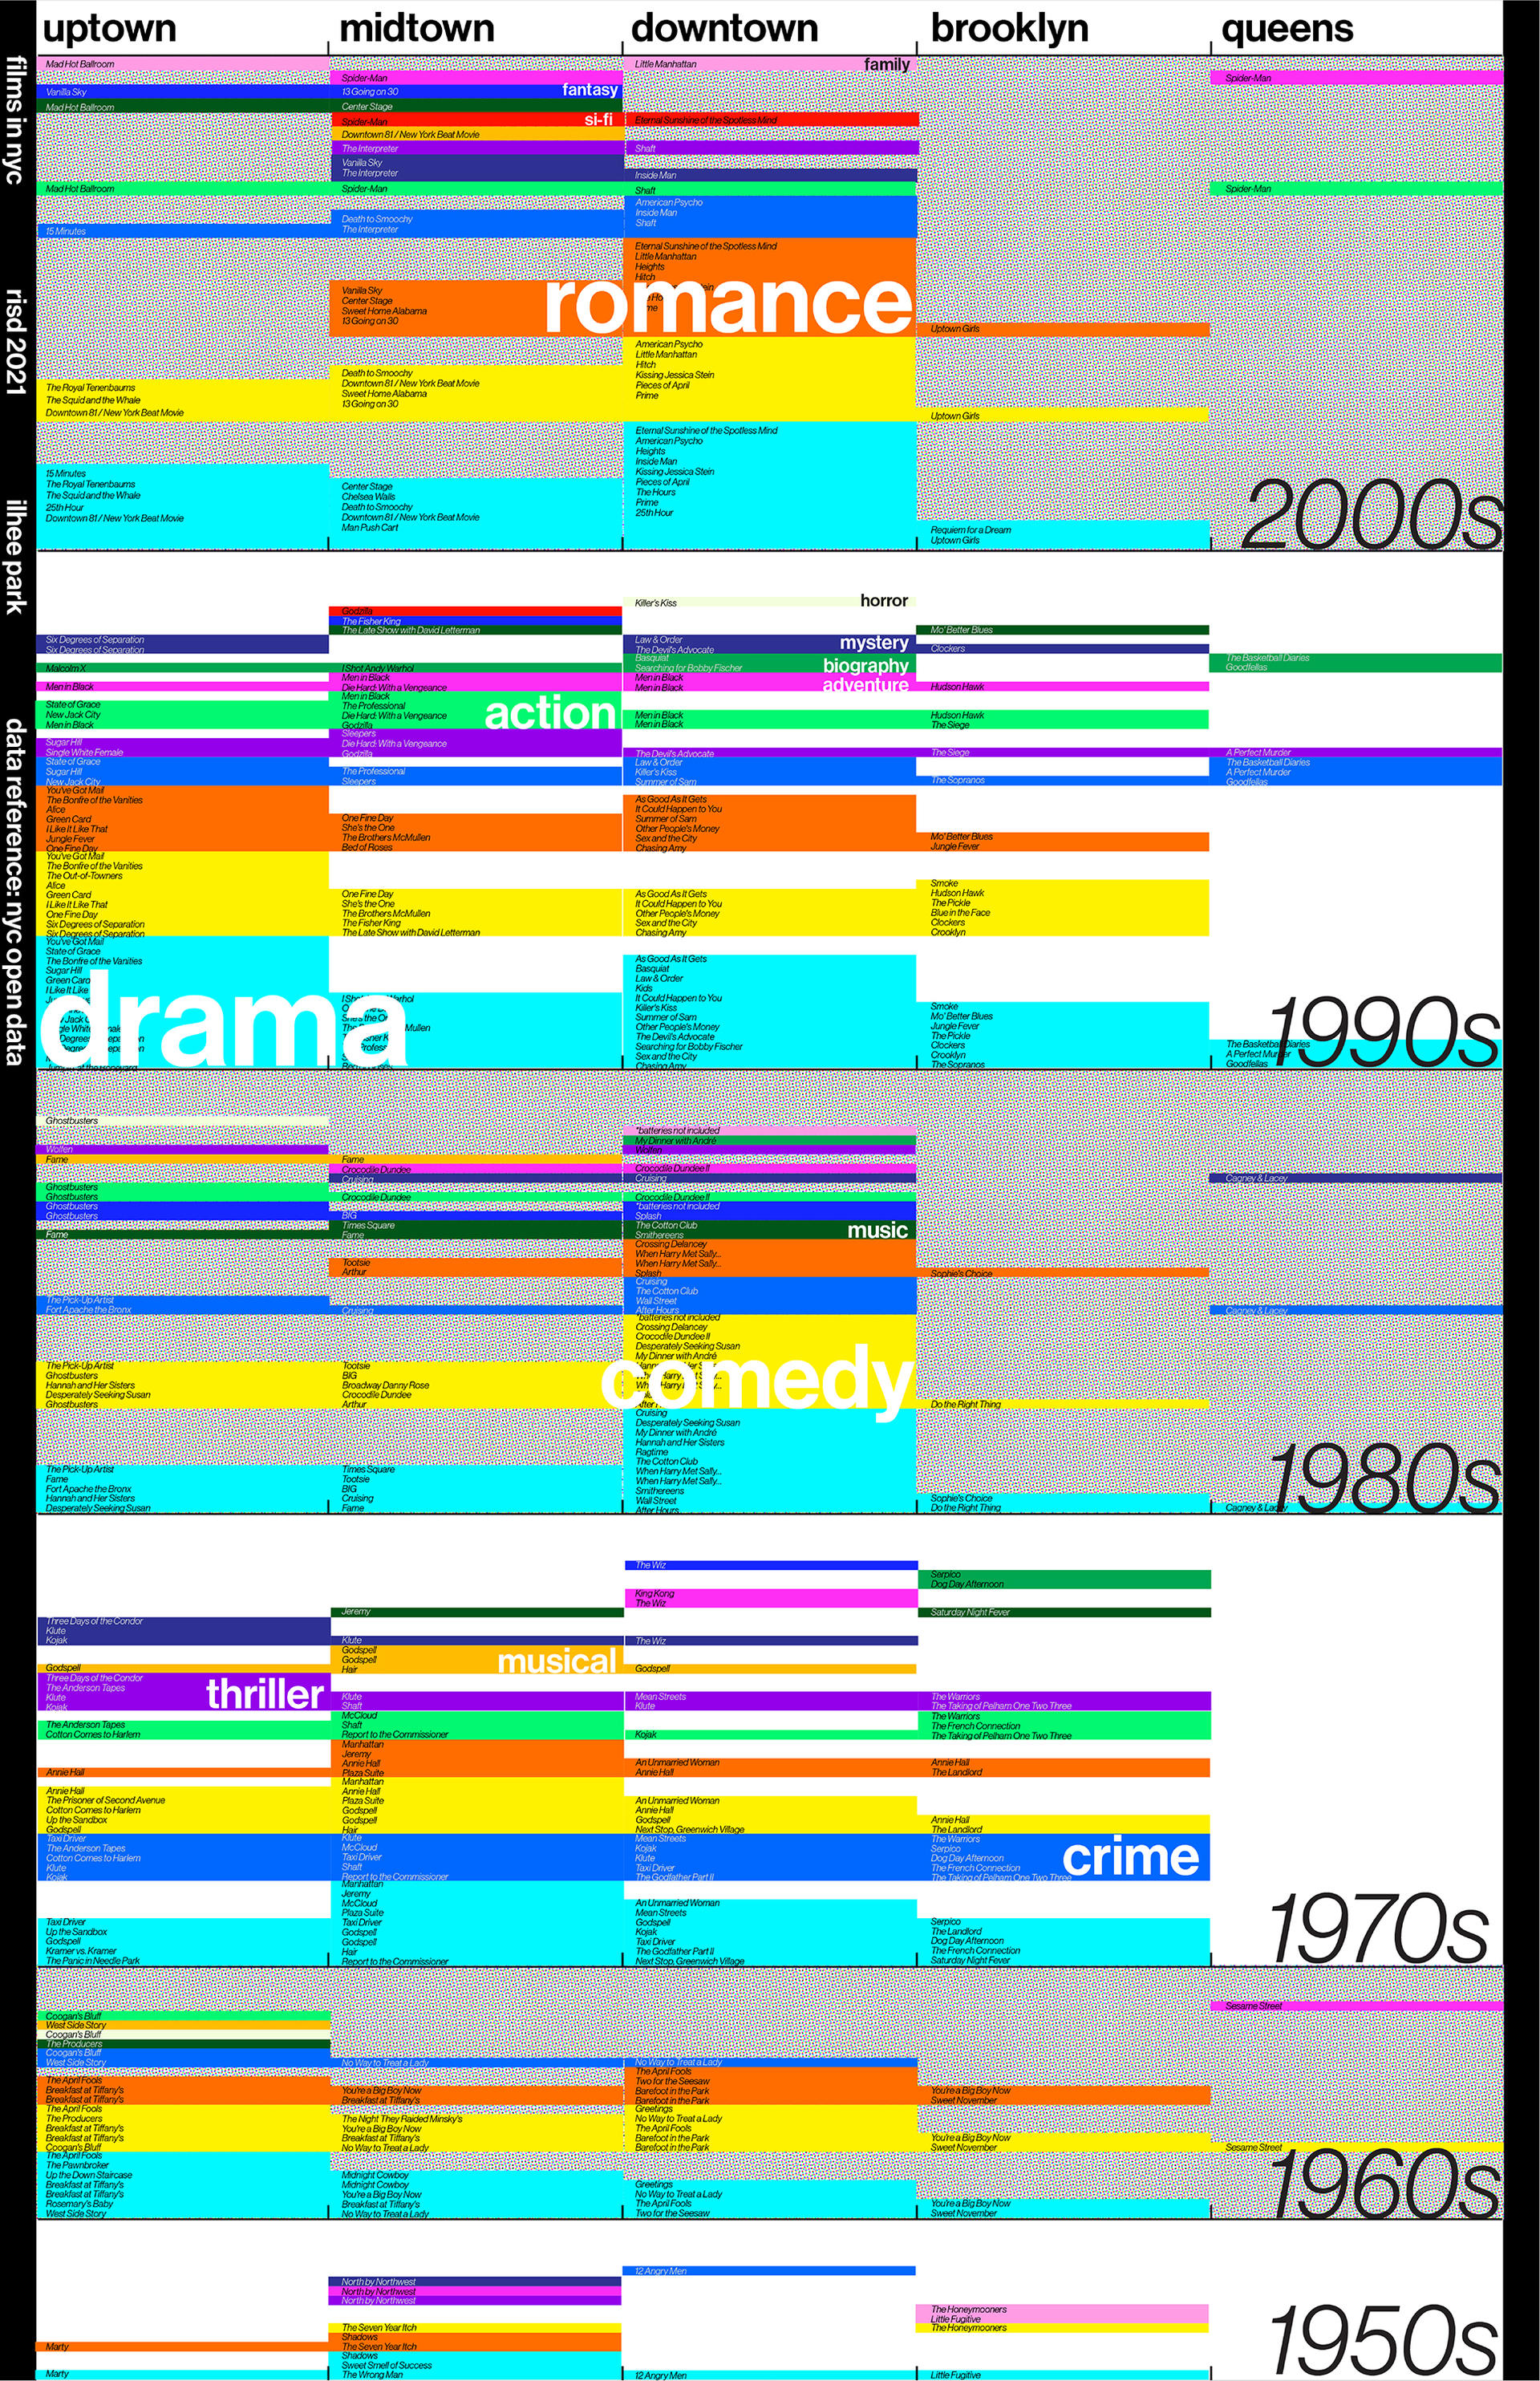
Films in New York City
Information Design, Graphic poster
25*39in
2021
I have compiled information about movies that were filmed in New York City during the 1950s-2000s. Each color represents the type of film, and the information is categorized according to different NYC locations, namely, Downtown, Midtown, Uptown, Brooklyn, and Queens. At a glance, there is an increase in types of movies as time goes on, and there have also been an increase in movies of a certain genre in a certain year. This indicates that movies also reflect the situation of the time.
Image
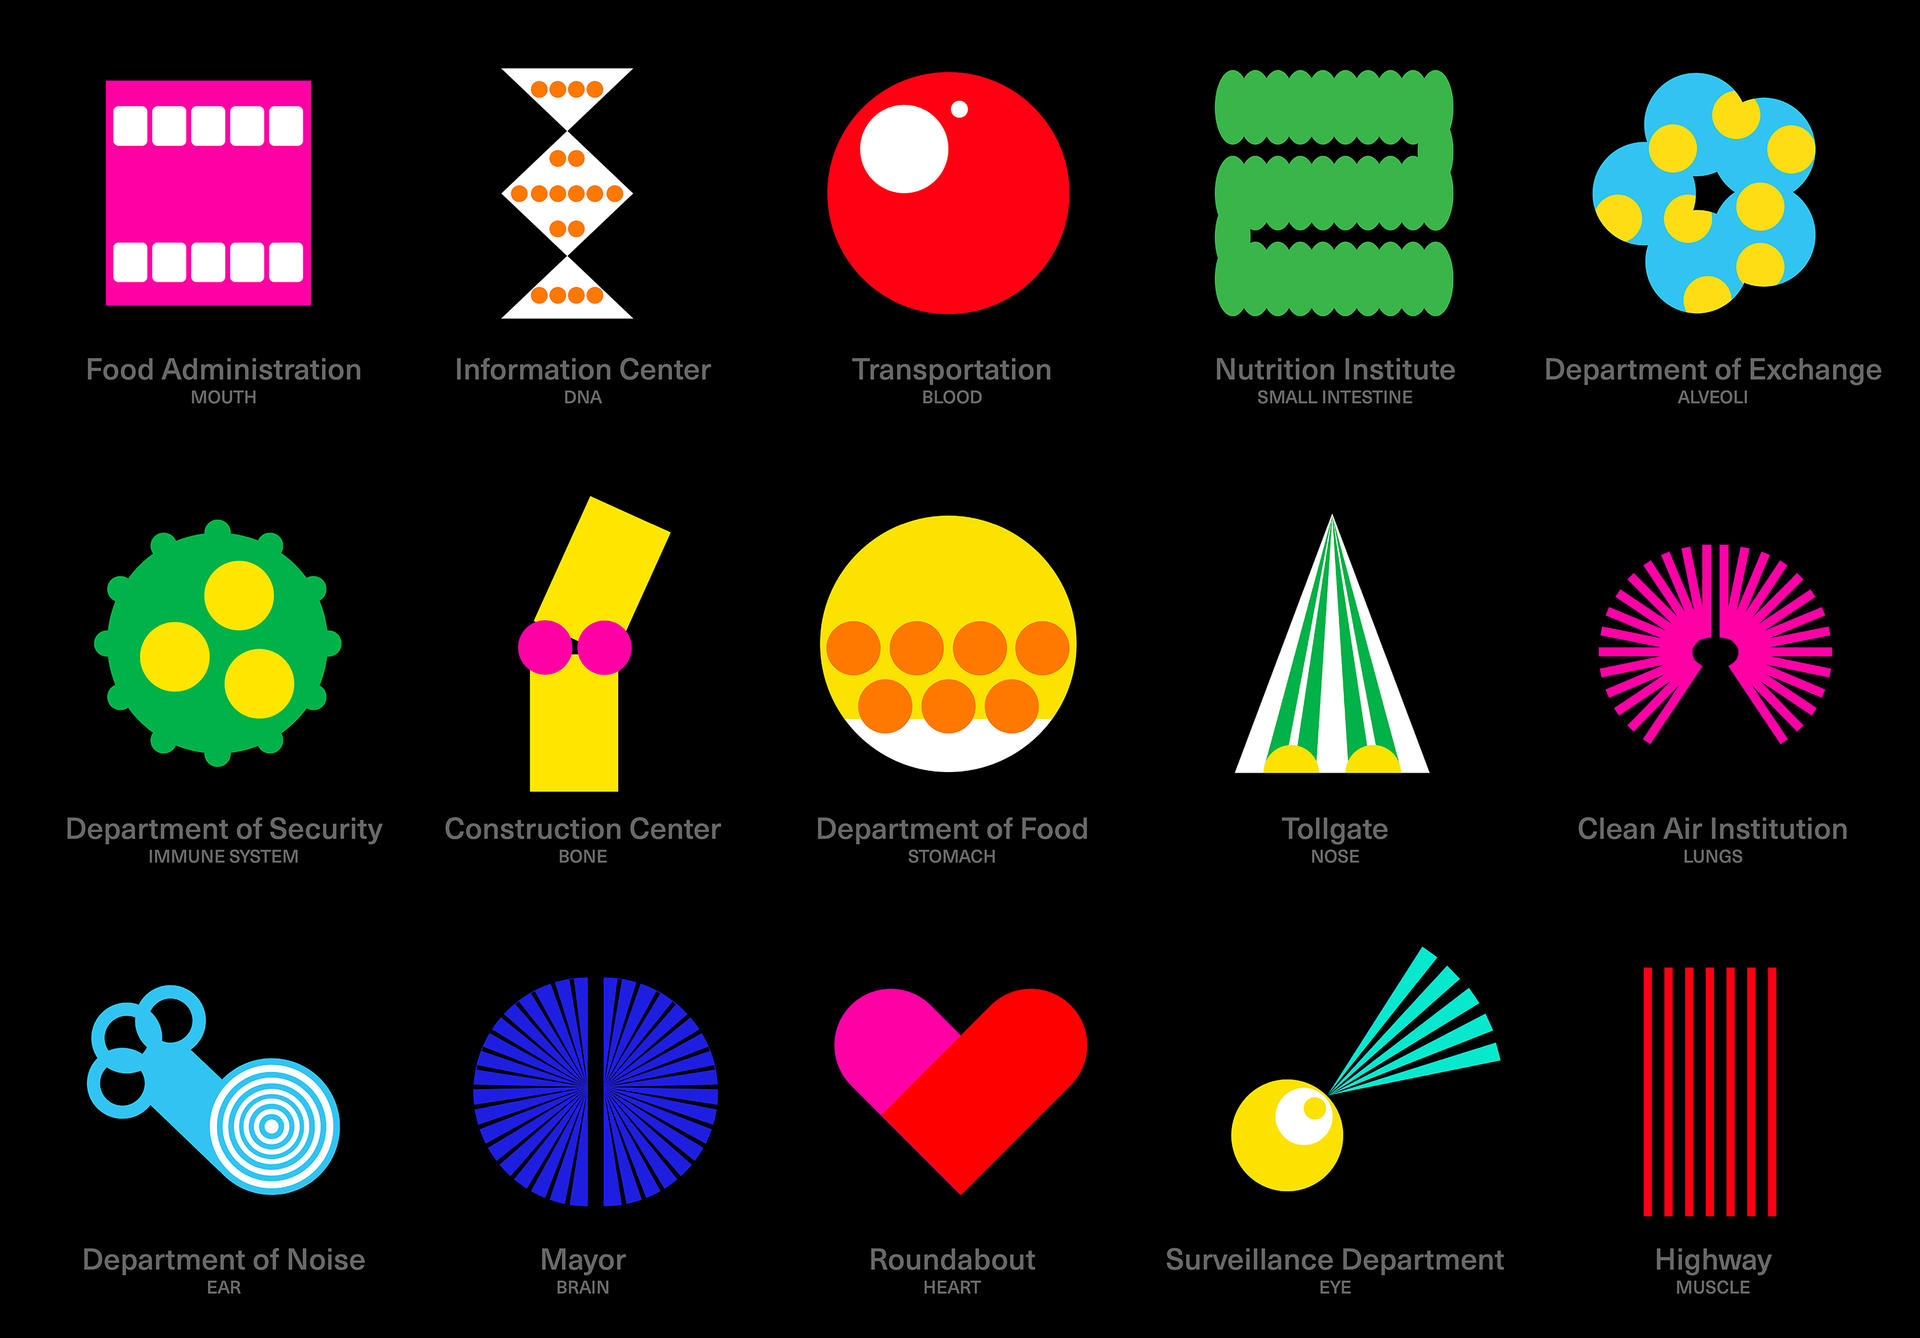
BodyCity
Iconography
Digital work
2021
Bodycity aims to deliver science-related information. This work includes a metaphor of the city to represent the information about the human body. Just as each department or institution in the city we live in does different things, they are also connected together so that the city can function. Similarly, each body part works together in their different roles to move our body. I visualized each body part through icons and applied a metaphor of the departments in a city that have similar functions.
Image
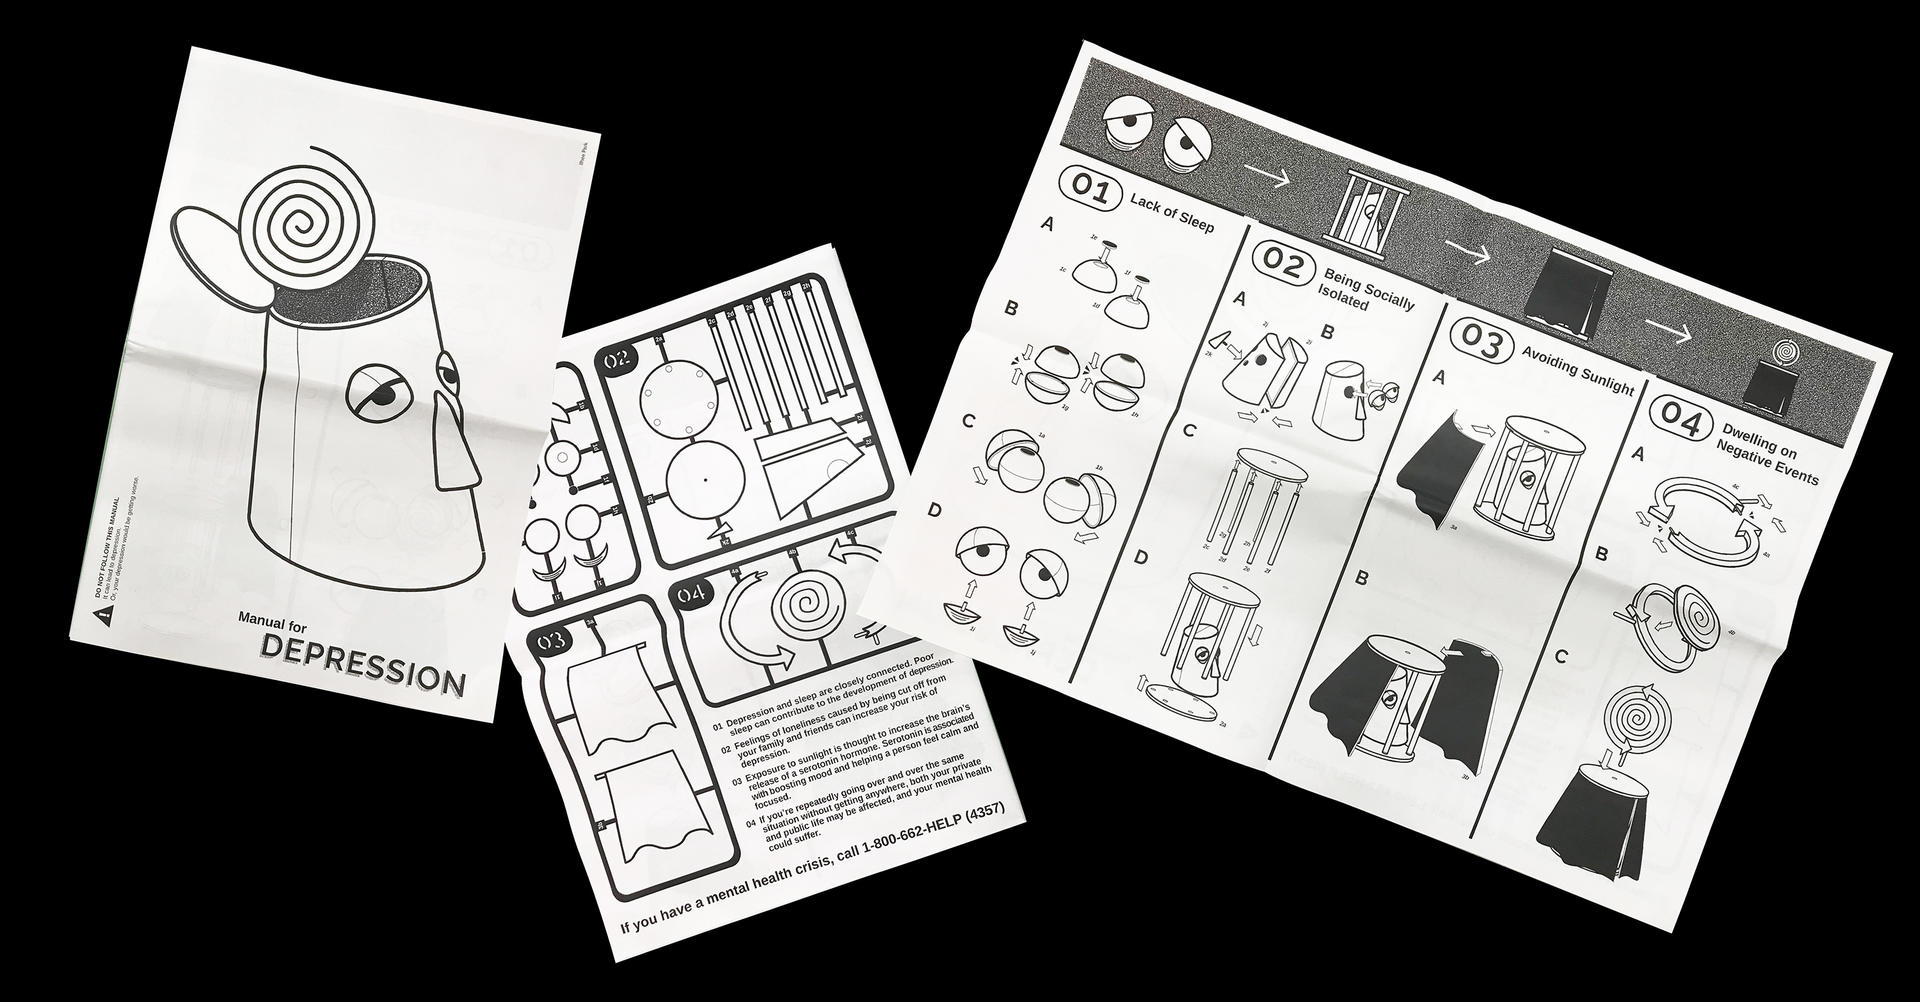
Manual for Depression
Newspaper
350*500mm
2021
On February 23, 1947, the International Organization of Standardization (ISO) was founded in Geneva, Switzerland, offering an extensive system of safety icons. With these guidelines for featuring communication through an accessible visual language, a parallel pictorial system came to mind: the Gundam Robot Building Instructions presented in Japanese. Even though I don’t know Japanese, I am able to build the robots since information was represented visually rather than through language. As mental health was a prominent topic in the media, I worked with the theme of depression. This manual will guide you through how to become depressed. In fact, the backside of this contains the meaning of “never imitate.” It tells people to avoid this method while showing the process of becoming depressed that no one wants.
Image
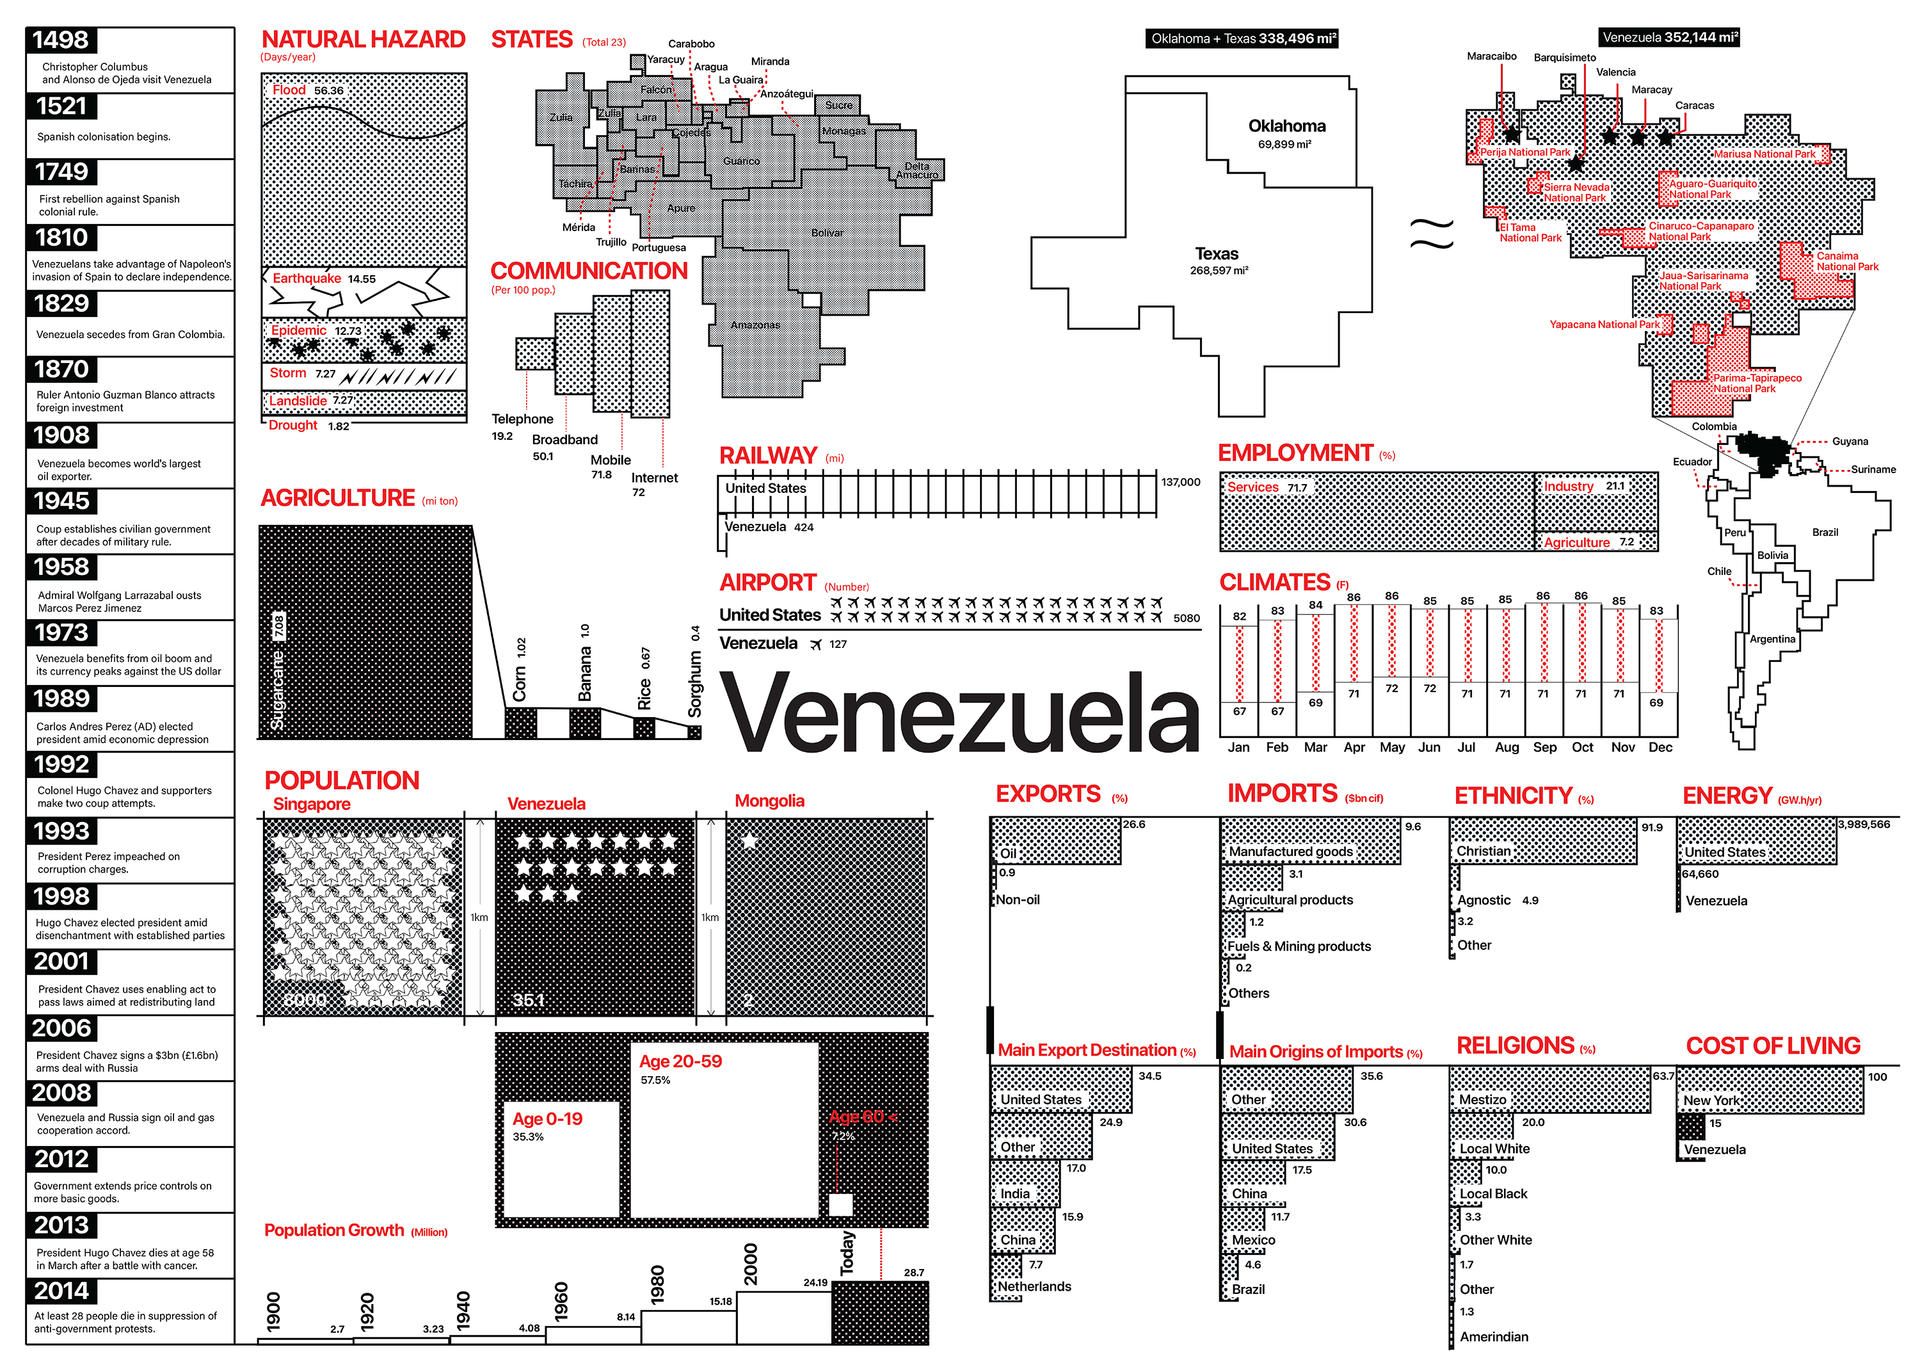
Venezuela Information Design
Newspaper spread
34*24in
2021
Venezuela’s data is presented in one newspaper spread. Inspired by the newspaper, all of the data and maps are represented in squares with black and white as the main colors; red is used as an accent color. Since most of the layout of the newspaper is rectangular, all the visual elements are represented using squares. I also drew graphs using metaphors such as trains, airplanes, thermometers, and natural disasters. The raw information was provided in text, and I retranslated the information using visual elements so that people can sense the scale, number, or history at a glance.
- Architecture
- Ceramics
- Design Engineering
- Digital + Media
- Furniture Design
- Global Arts and Cultures
- Glass
- Graphic Design
- Industrial Design
- Interior Architecture
- Jewelry + Metalsmithing
- Landscape Architecture
- Nature-Culture-Sustainability Studies
- Painting
- Photography
- Printmaking
- Sculpture
- TLAD
- Textiles